The service, which launched on 31 January 2024, allows community pharmacies to offer advice to patients and supply NHS medicines (where clinically appropriate) to treat 7 common health conditions (clinical pathways) without a prescription from a GP.
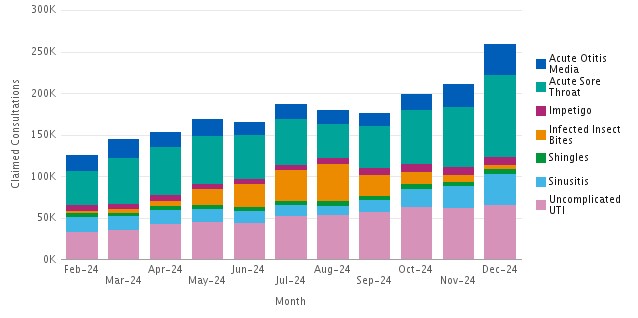
Claimed consultations and the number of community pharmacies claiming for NHS Pharmacy First Service
| Month |
Claimed consultations |
Claimed consultations with medicine supplied |
% where medicine supplied |
Community pharmacies claiming |
| February 2024 |
125,275 |
94,435 |
75.4 |
9,119 |
| March 2024 |
144,389 |
113,407 |
78.5 |
9,219 |
| April 2024 |
153,646 |
121,531 |
79.1 |
9,126 |
| May 2024 |
168,447 |
135,257 |
80.3 |
9,306 |
| June 2024 |
164,737 |
132,487 |
80.4 |
9,316 |
| July 2024 |
186,190 |
149,582 |
80.3 |
9,235 |
| August 2024 |
180,035 |
144,190 |
80.1 |
9,212 |
| September 2024 |
175,571 |
134,462 |
76.6 |
9,045 |
|
October 2024
|
198,794 |
152,679 |
76.8 |
9,257 |
| November 2024 |
211,386 |
161,697 |
76.5 |
9,308 |
| December 2024 |
259,323 |
200,163 |
77.2 |
9,393 |
| Grand total |
1,967,793 |
1,539,890 |
78.3 |
10,522 |
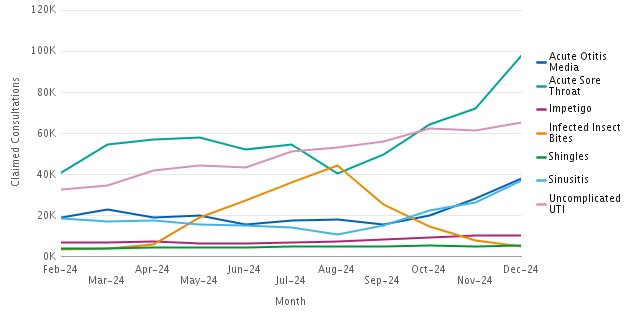
Consultations per clinical pathway for each month
Data for each clinical pathway
Acute Otitis Media
| Month |
Claimed Consultations |
Claimed Consultations with Medicine Supplied |
% Medicine Supplied |
Community Pharmacies Claiming |
| Feb-24 |
18,893 |
10,960 |
58.0 |
5,414 |
| Mar-24 |
22,888 |
15,386 |
67.2 |
6,375 |
| Apr-24 |
19,295 |
12,861 |
67.7 |
6,142 |
| May-24 |
20,240 |
14,139 |
69.9 |
6,425 |
| Jun-24 |
15,826 |
11,262 |
71.2 |
5,916 |
| Jul-24 |
17,682 |
12,354 |
69.9 |
6,145 |
| Aug-24 |
17,915 |
12,778 |
71.3 |
6,167 |
| Sep-24 |
15,680 |
10,957 |
69.9 |
5,883 |
| Oct-24 |
19,971 |
14,188 |
71.0 |
6,486 |
| Nov-24 |
28,205 |
20,703 |
73.4 |
7,183 |
| Dec-24 |
37,957 |
28,338 |
74.7 |
7,741 |
| Grand total |
234,552 |
163,926 |
69.89 |
No data |
Acute Sore Throat
| Month |
Claimed Consultations |
Claimed Consultations with Medicine Supplied |
% Medicine Supplied |
Community Pharmacies Claiming |
| Feb-24 |
41,014 |
28,157 |
68.7 |
7,467 |
| Mar-24 |
54,756 |
40,176 |
73.4 |
8,470 |
| Apr-24 |
56,925 |
41,947 |
73.7 |
8,504 |
| May-24 |
58,022 |
42,735 |
73.7 |
8,683 |
| Jun-24 |
52,288 |
38,152 |
73.0 |
8,550 |
| Jul-24 |
54,859 |
39,816 |
72.6 |
8,551 |
| Aug-24 |
40,771 |
28,894 |
70.9 |
8,210 |
| Sep-24 |
49,991 |
32,439 |
64.9 |
8,191 |
| Oct-24 |
64,617 |
42,913 |
66.4 |
8,549 |
| Nov-24 |
72,132 |
47,963 |
66.5 |
8,736 |
| Dec-24 |
97,961 |
66,717 |
68.1 |
9,058 |
| Grand total |
545,375 |
383,192 |
70.3 |
No data |
Impetigo
| Month |
Claimed Consultations |
Claimed Consultations with Medicine Supplied |
% Medicine Supplied |
Community Pharmacies Claiming |
| Feb-24 |
6,816 |
6,446 |
94.6 |
3,775 |
| Mar-24 |
6,740 |
6,408 |
95.1 |
3,846 |
| Apr-24 |
7,191 |
6,641 |
92.4 |
3,870 |
| May-24 |
6,235 |
5,840 |
93.7 |
3,645 |
| Jun-24 |
6,362 |
5,958 |
93.6 |
3,692 |
| Jul-24 |
6,740 |
6,181 |
91.7 |
3,742 |
| Aug-24 |
7,448 |
6,917 |
92.9 |
3,958 |
| Sep-24 |
8,390 |
7,777 |
92.7 |
4,231 |
| Oct-24 |
9,394 |
8,683 |
92.4 |
4,670 |
| Nov-24 |
10,254 |
9,466 |
92.3 |
4,867 |
| Dec-24 |
10,179 |
9,435 |
92.7 |
4,820 |
| Grand total |
75,570 |
70,317 |
93.0 |
No data |
Infected Insect Bites
| Month |
Claimed Consultations |
Claimed Consultations with Medicine Supplied |
% Medicine Supplied |
Community Pharmacies Claiming |
| Feb-24 |
3,412 |
2,841 |
83.3 |
2,295 |
| Mar-24 |
4,180 |
3,559 |
85.1 |
2,790 |
| Apr-24 |
6,099 |
5,135 |
84.2 |
3,563 |
| May-24 |
19,010 |
16,624 |
87.4 |
6,521 |
| Jun-24 |
27,294 |
23,528 |
86.2 |
7,528 |
| Jul-24 |
36,370 |
31,218 |
85.8 |
7,973 |
| Aug-24 |
44,391 |
36,784 |
82.9 |
8,256 |
| Sep-24 |
25,348 |
19,974 |
78.8 |
7,143 |
| Oct-24 |
14,715 |
11,507 |
78.2 |
5,826 |
| Nov-24 |
7,846 |
5,996 |
76.4 |
4,148 |
| Dec-24 |
5,074 |
3,863 |
76.1 |
3,031 |
| Grand total |
193,739 |
161,029 |
83.1 |
No data |
Shingles
| Month |
Claimed Consultations |
Claimed Consultations with Medicine Supplied |
% Medicine Supplied |
Community Pharmacies Claiming |
| Feb-24 |
4,078 |
3,336 |
81.8 |
2,822 |
| Mar-24 |
4,069 |
3,452 |
84.8 |
2,889 |
| Apr-24 |
4,470 |
3,817 |
85.4 |
3,074 |
| May-24 |
4,691 |
4,065 |
86.7 |
3,151 |
| Jun-24 |
4,626 |
3,979 |
86.0 |
3,167 |
| Jul-24 |
5,103 |
4,333 |
84.9 |
3,361 |
| Aug-24 |
5,151 |
4,372 |
84.9 |
3,447 |
| Sep-24 |
4,867 |
4,042 |
83.0 |
3,308 |
| Oct-24 |
5,344 |
4,458 |
83.4 |
3,549 |
| Nov-24 |
5,175 |
4,335 |
83.8 |
3,472 |
| Dec-24 |
5,530 |
4,627 |
83.7 |
3,647 |
| Grand total |
53,104 |
44,816 |
84.4 |
No data |
Sinusitis
| Month |
Claimed Consultations |
Claimed Consultations with Medicine Supplied |
% Medicine Supplied |
Community Pharmacies Claiming |
| Feb-24 |
18,384 |
15,819 |
86.0 |
5,935 |
| Mar-24 |
17,220 |
15,082 |
87.6 |
6,100 |
| Apr-24 |
17,715 |
15,538 |
87.7 |
6,148 |
| May-24 |
15,909 |
13,689 |
86.0 |
6,011 |
| Jun-24 |
15,052 |
12,613 |
83.8 |
5,874 |
| Jul-24 |
14,115 |
11,829 |
83.8 |
5,693 |
| Aug-24 |
10,970 |
8,788 |
80.1 |
4,992 |
| Sep-24 |
15,059 |
11,946 |
79.3 |
5,729 |
| Oct-24 |
22,456 |
18,282 |
81.4 |
6,773 |
| Nov-24 |
26,379 |
21,659 |
82.1 |
7,165 |
| Dec-24 |
37,330 |
31,911 |
85.5 |
7,972 |
| Grand total |
210,589 |
177,156 |
84.1 |
No data |
Uncomplicated UTI
| Month |
Claimed Consultations |
Claimed Consultations with Medicine Supplied |
% Medicine Supplied |
Community Pharmacies Claiming |
| Feb-24 |
32,678 |
26,876 |
82.2 |
7,593 |
| Mar-24 |
34,536 |
29,344 |
85.0 |
8,088 |
| Apr-24 |
41,951 |
35,592 |
84.8 |
8,304 |
| May-24 |
44,340 |
38,165 |
86.1 |
8,577 |
| Jun-24 |
43,289 |
36,995 |
85.5 |
8,591 |
| Jul-24 |
51,321 |
43,851 |
85.4 |
8,718 |
| Aug-24 |
53,389 |
45,657 |
85.5 |
8,745 |
| Sep-24 |
56,236 |
47,327 |
84.2 |
8,652 |
| Oct-24 |
62,297 |
52,648 |
84.5 |
8,882 |
| Nov-24 |
61,395 |
51,575 |
84.0 |
8,920 |
| Dec-24 |
65,292 |
55,272 |
84.7 |
9,014 |
| Grand total |
546,724 |
463,302 |
84.7 |
No data |
Consultations per clinical pathway by month
Cumulative clinical pathway consultations by month
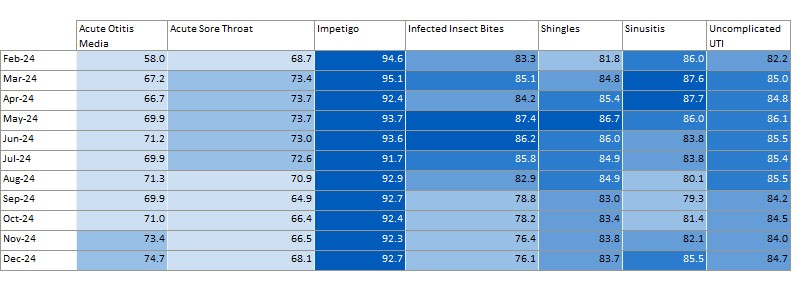
Percentage of consultations where medicine was supplied per clinical pathway, by month


